Austrians can continue to rely on their electricity and gas supplies. The current outage and disruption statistics for electricity and gas continue to show very good values for the availability of electricity and gas supplies, even if the duration of outages has increased compared to the previous year.
“The average outage duration due to unplanned power outages was 32.27 minutes, and that of unplanned gas outages was 1.44 minutes. The year before, we had 24.17 minutes of unplanned interruptions in the electricity supply and 1.07 minutes in the gas supply. This increase is mainly due to the increase in regionally exceptional events in the electricity supply. However, the reliability of the electricity and gas supply can still be described as very good,” explains E-Control board member Alfons Haber, explaining the results from E-Control’s electricity and gas outage and disruption statistics that have just been published.
Graphic 1: Unplanned customer-related unavailability of electricity in Austria in minutes (calculation according to SAIDI)
Graphic 2: Unplanned customer-related unavailability of gas in Austria in minutes (calculated according to SAIDI)
The average duration of unplanned outages in gas is always much shorter than in electricity. “This is mainly because underground gas pipelines are less affected by external environmental influences than overhead electricity lines. In addition, the unplanned interruption duration in the winter months is significantly shorter than during the summer. We assume that in the winter, due to the significantly higher gas dependency of customers, even faster damage repair will be necessary in the event of disruptions,” explains Haber.
Calculation of the different reliability indicators and their meaning
Since 2003, E-Control has been calculating various reliability indicators, some of which can also be used for a European comparison. The customer-weighted indicator SAIDI plays a particularly important role here for national and international comparison. “This refers to how long on average a customer had no electricity or gas. In addition to the SAIDI, the ASIDI is also calculated for electricity. This takes into account the failed transformer power over time and represents an indicator related to the electrical power,” says Haber. The exact calculation of all key figures or the figures that have already been calculated can be found in the annually published reports by E-Control on electricity and gas outage and disruption statistics(1) be removed.
Weather plays a major role in the evaluation
Supply interruptions have a variety of reasons. Generally, these are divided into planned and unplanned causes. “In the event of planned interruptions, customers are informed in advance about a shutdown, for example due to planned work in the supply network. Unplanned supply interruptions occur in connection with external influences, system failures or other disruptions,” explains E-Control board member Wolfgang Urbantschitsch, explaining details from the statistics.
Unplanned causes for electricity are divided into five different categories. These include atmospheric influences, external influences, reasons internal to the network operator as well as feedback disturbances and regionally exceptional events. “Regionally exceptional events are, for example, extreme storms, which can pose difficult tasks for network operators and which are considered separately in the statistics. When it comes to unplanned causes in 2023, it was shown that regionally exceptional events were the most common cause of failure, accounting for almost a quarter of all interruptions. Atmospheric reasons were the second most common reason at 18%, followed by causes internal to the network operator at just over 10%, which include, for example, incorrect switching or the failure of network elements,” says Urbantschitsch.
The supply interruptions caused by exceptional regional events have increased significantly compared to the previous year, namely from almost 11% to almost 24%. The south of Austria in particular was affected by regionally exceptional events such as massive snowfalls or extreme storms. Most supply interruptions in 2023 occurred in the months of December and July, followed by January, August and February.
Graphic 3: Reasons for unplanned electricity supply interruptions.
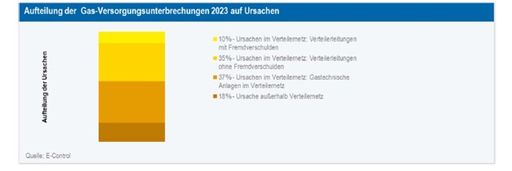
In the gas sector, it has been shown that only around 18% of the reported supply interruptions were outside the distribution network (e.g. a defective gas boiler in the customer’s system). Interruptions caused by the distribution network are divided into causes without third-party fault at 35% and gas-technical systems in the distribution network at 37%. A comparatively small proportion of around 10% is due to third-party causes,” explains Urbantschitsch.
Graphic 4: Reasons for unplanned gas supply interruptions.
A detailed description of the causes of failure can also be found in the annual report on failure and disruption statistics.
Network operators as contacts for customers
“In the event of a supply interruption, the respective network operator – depending on the network area – is the contact person for those affected. Customers have the opportunity to inquire about outage indicators in their own network area. The main reliability indicators, SAIDI and ASIDI, for the respective network area can be found on the network operator’s website,” Urbantschitsch concludes by pointing out the opportunity for customers to find out more detailed information about their own network operator.
Electricity and gas outage and disruption statistics for the 2023 reporting year
https://www.e-control.at/ausfall-und-stoerungsstatistik
